Both the popular press and scientific literature have documented the recent wave of forest clearing in South America's moist tropical forests. Less well known is the systematic degradation and conversion over the last two centuries of all types of vegetation in South America. New maps developed from satellite imagery have helped put the changes into proper perspective.
From this work and other sources, it is evident that at least one-fifth of the original land cover of South America has been changed, degraded, or converted to other uses since the arrival of Columbus. It is also clear that the rate of change has risen rapidly in recent decades. This is not surprising, given that the continent's population has doubled from 150 million to 300 million over the last 30 years. Moreover, the changes have come fastest in the last decade, particularly in the tropical moist forests of the Amazon Basin.
The series of maps beginning on page 68 derives from research conducted by myself and others at the Woods Hole Research Center over the past year. We relied on data from National Oceanic and Atmospheric Administration's weather satellites, which can yield twice daily images of ground features a half mile across or larger. Photographs, earlier vegetation maps, personal experience on the ground, and higher-resolution images that other satellites have produced for select parts of South America supplemented the low-resolution satellite information.
For mapping vegetation, satellite images can replace or be combined with traditional ground-based studies. Satellite images are valuable for mapping in part because new data can be acquired daily. Moreover, they provide a broad view of hundreds of square miles of land unimpeded by political boundaries. On the other hand, satellite images don't reveal what species of plants comprise the ground cover, interpreting data is difficult, clouds often cover some tropical regions, and the technique requires an investment in computer hardware and software.
Because of these shortcomings, traditional vegetation maps, particularly those that are digitized, often augment satellite data. For example, in constructing these satellite-based digital maps, we referred to two well-known maps of South American vegetation: one created by Kurt von Hueck in 1972 and the other by UNESCO in 1980. We also consulted many atlases and smaller-scale vegetation maps of varying quality.
The images used to create the maps here, which are low-resolution and taken daily, reveal large-scale and more recent changes. Combined with high-resolution images of smaller areas, taken at intervals of perhaps two weeks, they can provide valuable tools for indigenous peoples and local communities in South America. For example, high-resolution images have helped rubber tappers in Amazonia document and combat incursions into the territories on which their livelihood depends. Because satellite images are a visual record, members of a community can better comprehend the environmental changes that threaten their survival.
THE LAND COVER...THEN
In analyzing the data, we described 39 classes of land cover for the continent, which were simplified into 14 broad categories, with 1988 as the base year (see the table on page 67). The categories contain such major groups as intact and degraded tropical moist forest and intact and degraded closed canopy forest. Minor groups range from desert to water, and show no significant change from pre-colonial times. "Degraded" means that the land cover differs from natural or primary vegetation. For example, all land devoted to conventional agriculture is degraded - it isn't in its natural state.
To calculate what the natural vegetation cover was during pre-colonial times and before significant human disturbances, we combined the disturbed and undisturbed categories in our satellite-based map of South America. Our estimates of pre-disturbance land cover of South America appear in the table and agree roughly with other research, such as the 1983 work of Elaine Matthews and her colleagues at the NASA Goddard Institute of Space Studies on tropical moist forest, closed canopy forest, and scrub shrubland.
No one denies that the indigenous peoples of South America played a role in changing some types of South America's vegetation cover during precolonial times. But, with at most 20 million indigenous peoples living on the continent around the year 1500, the damage was probably minimal when Europeans first arrived.
In fact, it is difficult to document any large-scale manipulation of South America's lowland landscape in preColumbian times. Unlike Central America and some Andean regions, where maize, potatoes, and other crops were essential for relatively large populations, changes in the landscape of lowland South America occurred largely over slash-and-burn cycles of 60 years or longer.
The conversion that did occur consisted of farming small tribal plots, as well as burning to maintain grasslands to make travel and hunting easier. And, unlike the Europeans that followed them, the first Indian settlers of the Americas brought with them no new plants, instead cultivating what they found upon their arrival.
AND NOW
According to our estimates, about 18 percent of the total area of South America - about 1.26 million square miles - has been degraded or otherwise converted for direct human use over the last 500 years. Of this 18 percent, 3 percent results from losing or converting primary forest during the last decade in South America's tropical moist forests.
At first glance, it may seem heartening that recent deforestation is only a small part of the total change over centuries for South America. However, of the 18 percent conversion of the original land cover, the other 15 percent took perhaps 150 to 200 years to occur. This comes out to a loss of about 0.08 percent to 0.1 percent annually. In contrast, converting 3 percent of the tropical moist forest over the last decade represents a loss of 0.3 percent per year - and effective tripling of the rate of change and degradation.
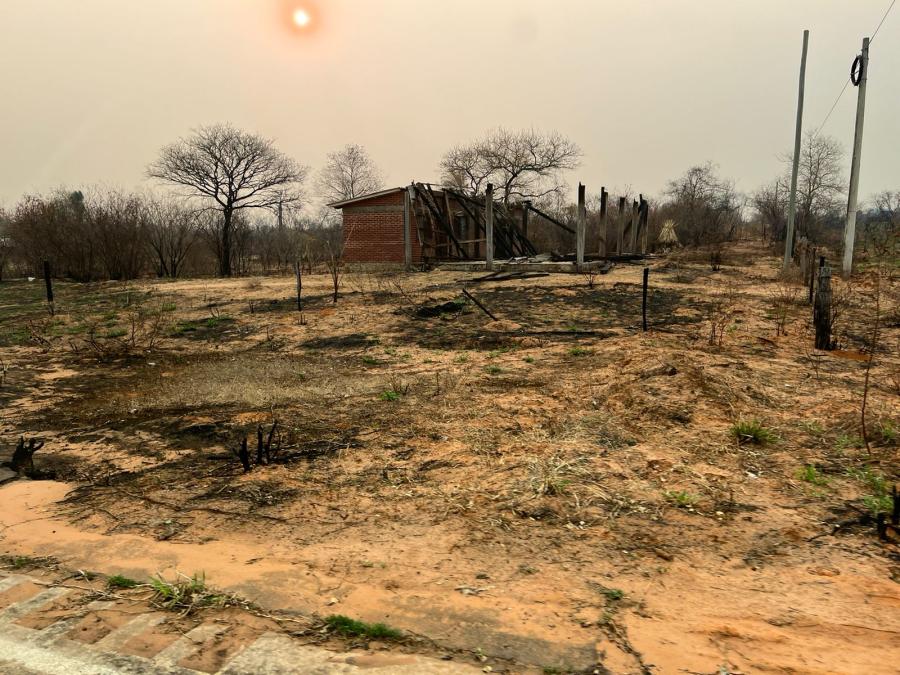
South America's largest total losses or conversions of natural land cover have occurred in closed canopy forest regions. These have declined 22 percent (see maps 1A and 1B). Nearly 696,000 square miles of closed forest have been lost, converted, or degraded. Of this, over 217,000 square miles - 31 percent of the total closed forest lost - have disappeared in the last decade. Almost all these losses have occurred along the Brazilian coast, heavily occupied since colonial times, and in the Amazon Basin. Brazil's Atlantic tropical moist and seasonal forests and the once-vast Arucaria pine forests have been reduced to a mere 1 percent in an undisturbed condition and to 7 percent in any condition from its original 400,000 square miles, according to Robert Peters and Tom Lovejoy of the World Wildlife Fund and the Smithsonian Institution. In all, Brazil has apparently converted some 650,000 square miles of tropical closed canopy forest to other uses, fully 30 percent of its total closed forest.
The second category of significant loss or conversion has affected the savannah-grasslands. Here a decline of about 23 percent of that land cover represents a change of over 300,000 square miles to other uses or converted to wastelands (see maps 2A and 2C). About 30 percent of these changes have occurred in Argentina and about 22 percent in Brazil. Peru, Bolivia, Venezuela, and Colombia account for 12, 11, 10, and 8 percent, respectively, of these changes in original savannah-grasslands.
The third largest category of loss or conversion is woodlands. These losses represent a decline in the total area of woodlands for South America of about 18 percent or about 270,000 square miles (see maps 3A & 3B). Most of these changes have affected Brazil (50 percent), Bolivia (15 percent), Peru (12 percent), and Paraguary (8 percent).
Finally, these maps are based largely on low-resolution satellite information, as well as work that is now somewhat out of date. Thus, the estimates of changed land cover for South America probably underestimate not only the area transformed but also the loss of biological diversity. Significant and extensive losses of most large animal species are occurring even while most of the land cover seen from the perspectives of either satellites or map makers remains deceptively unchanged.
FOR FURTHER READING
Foster Brown and Thomas A. Stone, "Using Satellite Photography for Grassroots Development in Amazonia," Cultural Survival Quarterly, Vol. 13, No.1, 1989.
B.L. Turner, William Clark, Robert Kates, John Richards, Jessica Matthews, and William Myer, eds., The Earth as transformed by Human Action, Cambridge University Press, 1990.
South America's Disappearing Natural Vegetation
(thousands of square miles)
Current Continental Area Pre-Disturbance Area Decline
MAJOR CATEGORIES
Tropical moist
forest (TMF) 2,281.8 33.4% 2,499.4 36.5% 8.7%
Degraded TMF 217.5 3.2%
Closed Canopy forest 2,521.5 36.9% 3,217.9 47.0% 21.6%
Degraded closed
canopy forest 696.4 10.2%
Woodlands 1,200.7 17.6% 1,458.2 21.3% 17.7%
Degraded woodlands 257.5 3.8%
Savannah-grasslands 1,020.1 14.9% 1,332.2 19.5% 23.4%
Degraded Savannah-
grasslands 312.2 4.6%
Shrublands and
Scrublands 417.2 6.1% 417.2 6.1%
MINOR CATEGORIES
Desert, bare soil 128.1 1.9% 128.1 1.9%
Water 63.1 0.9% 63.0 0.9%
Snow, rock and rice 18.9 0.3% 18.9 0.3%
Other (wet vegetation
and mangroves) 83.9 1.2% 83.9 1.2%
Unclassified 120.9 1.8% 120.9 1.8%
Note: Tropical moist forest is a subcategory of closed canopy forest.
Article copyright Cultural Survival, Inc.


